2024's Fire Safety Report: Which States Are Safest and Which Are Most at Risk?
July 14, 2024
Joel Efosa
Joel efosa is an experienced NATIONWIDE fire damage real estate investor. As owner of fire cash buyer, my goal is to provide fire victims with more options wether its rehab, sell or financial help.
He’s been featured on multiple publications including
Realtor, Yahoo Finance, Business Insider, Nasdaq, MSN, Fox, Go Banking Rates, Homelight
At Fire Cash Buyer, we promote strict editorial integrity in each of our posts.

Introduction
House fire safety is a critical concern that varies significantly across the United States, impacting lives, property, and communities. This article examines the latest data on residential fire safety, comprehensively analyzing how each state fares regarding fire-related deaths, injuries, professional firefighting resources, and reported home fire fatalities.
The analysis is based on four key metrics: deaths per 1,000 residential fires, injuries per 1,000 residential fires, the percentage of career fire departments, and the total number of home fire fatalities reported. The data was gathered from the most recent information available from the US Fire Administration.
In the following sections, we delve into the specifics of each state's performance, presenting key findings and additional insights to understand better the landscape of house fire safety in the U.S.
Key Findings:
- Rhode Island achieves the highest safety score (90) due to low death (0.9) and injury rates (15.7) per 1,000 residential fires and a substantial percentage (35.3) of professional firefighters in fire departments.
- In contrast, Alaska’s low score (40) reflects its high death (25.5) and injury (64.4) rates per 1,000 residential fires despite a reasonable percentage of career fire departments (10.4).
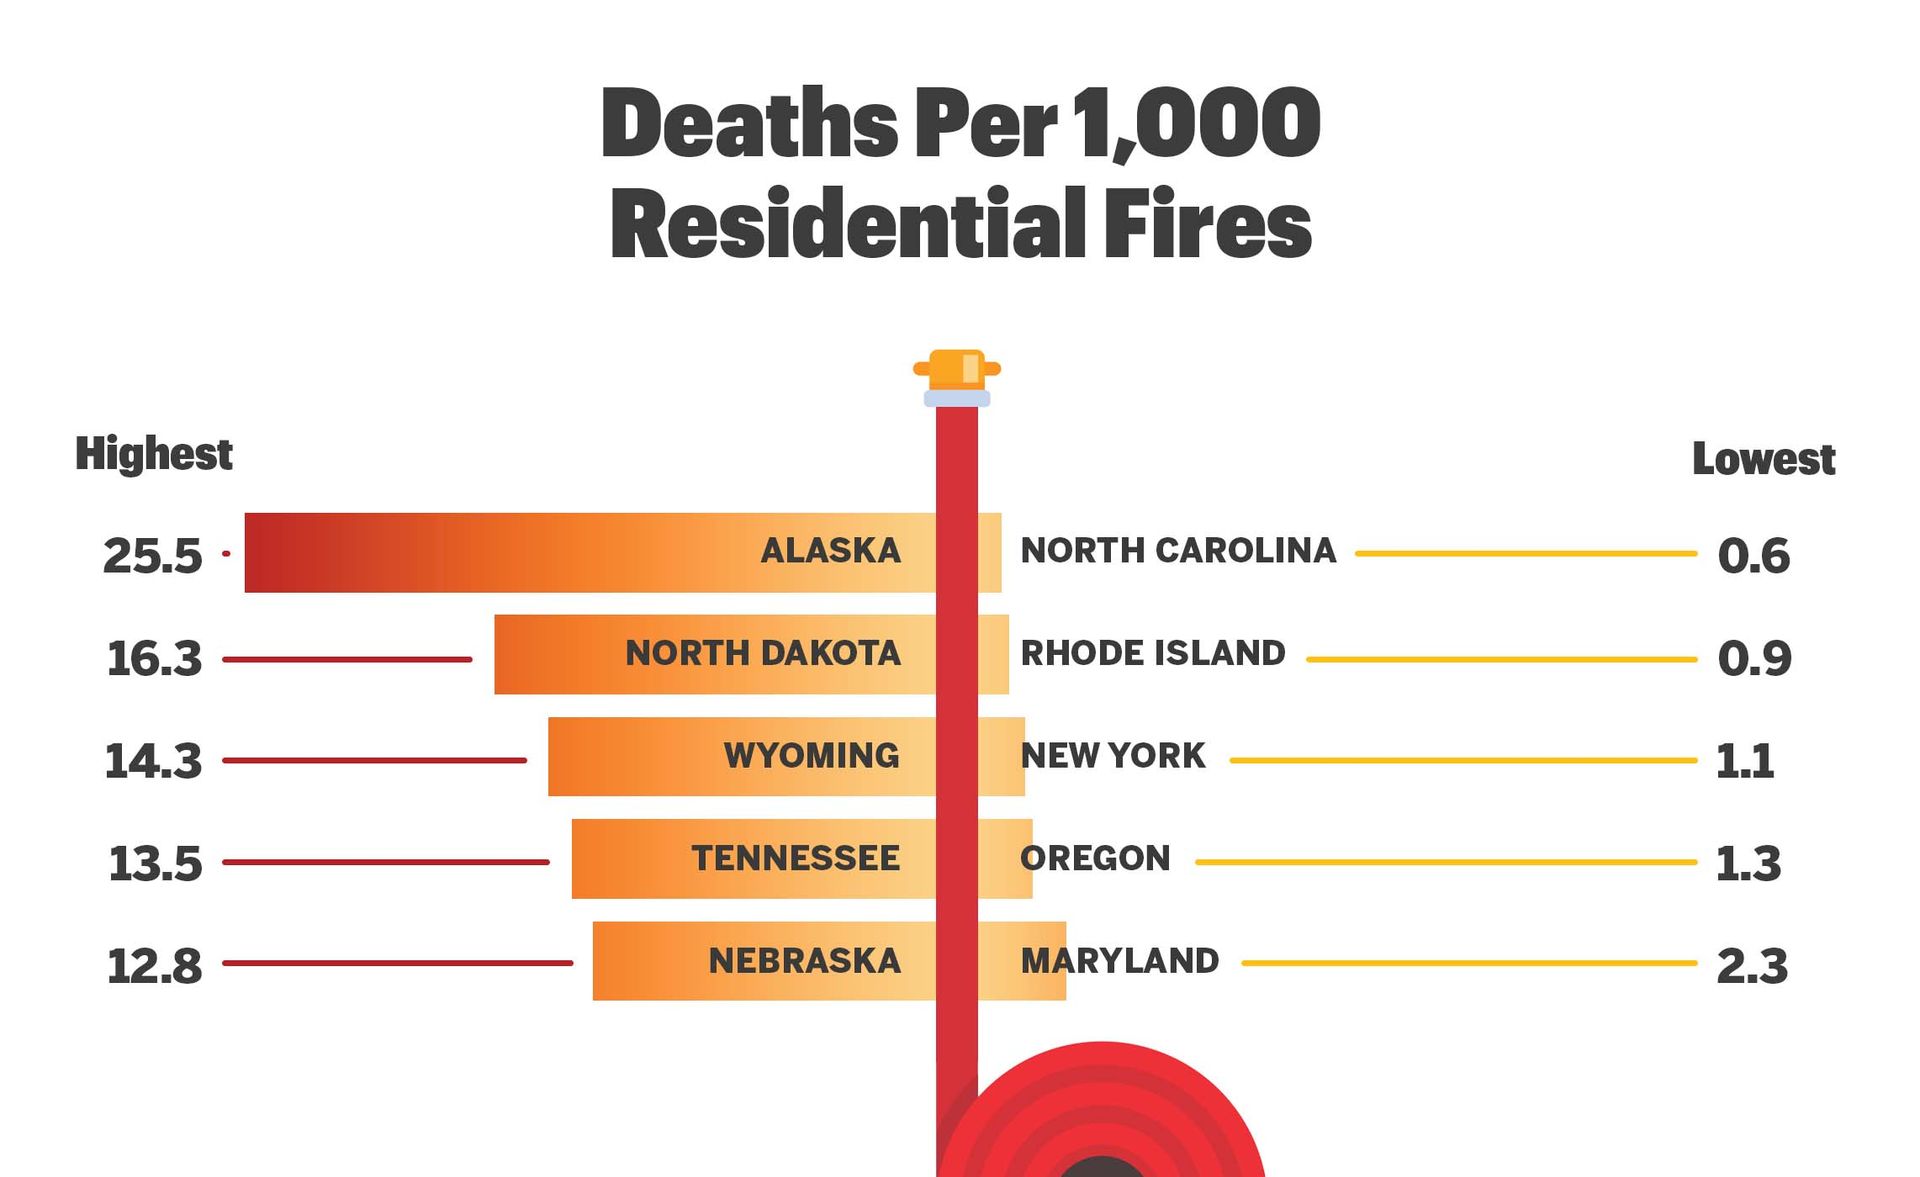
- North Carolina has an exceptionally low death rate (0.6), significantly better than Alaska's, which has the highest death rate (25.5) by a substantial margin.
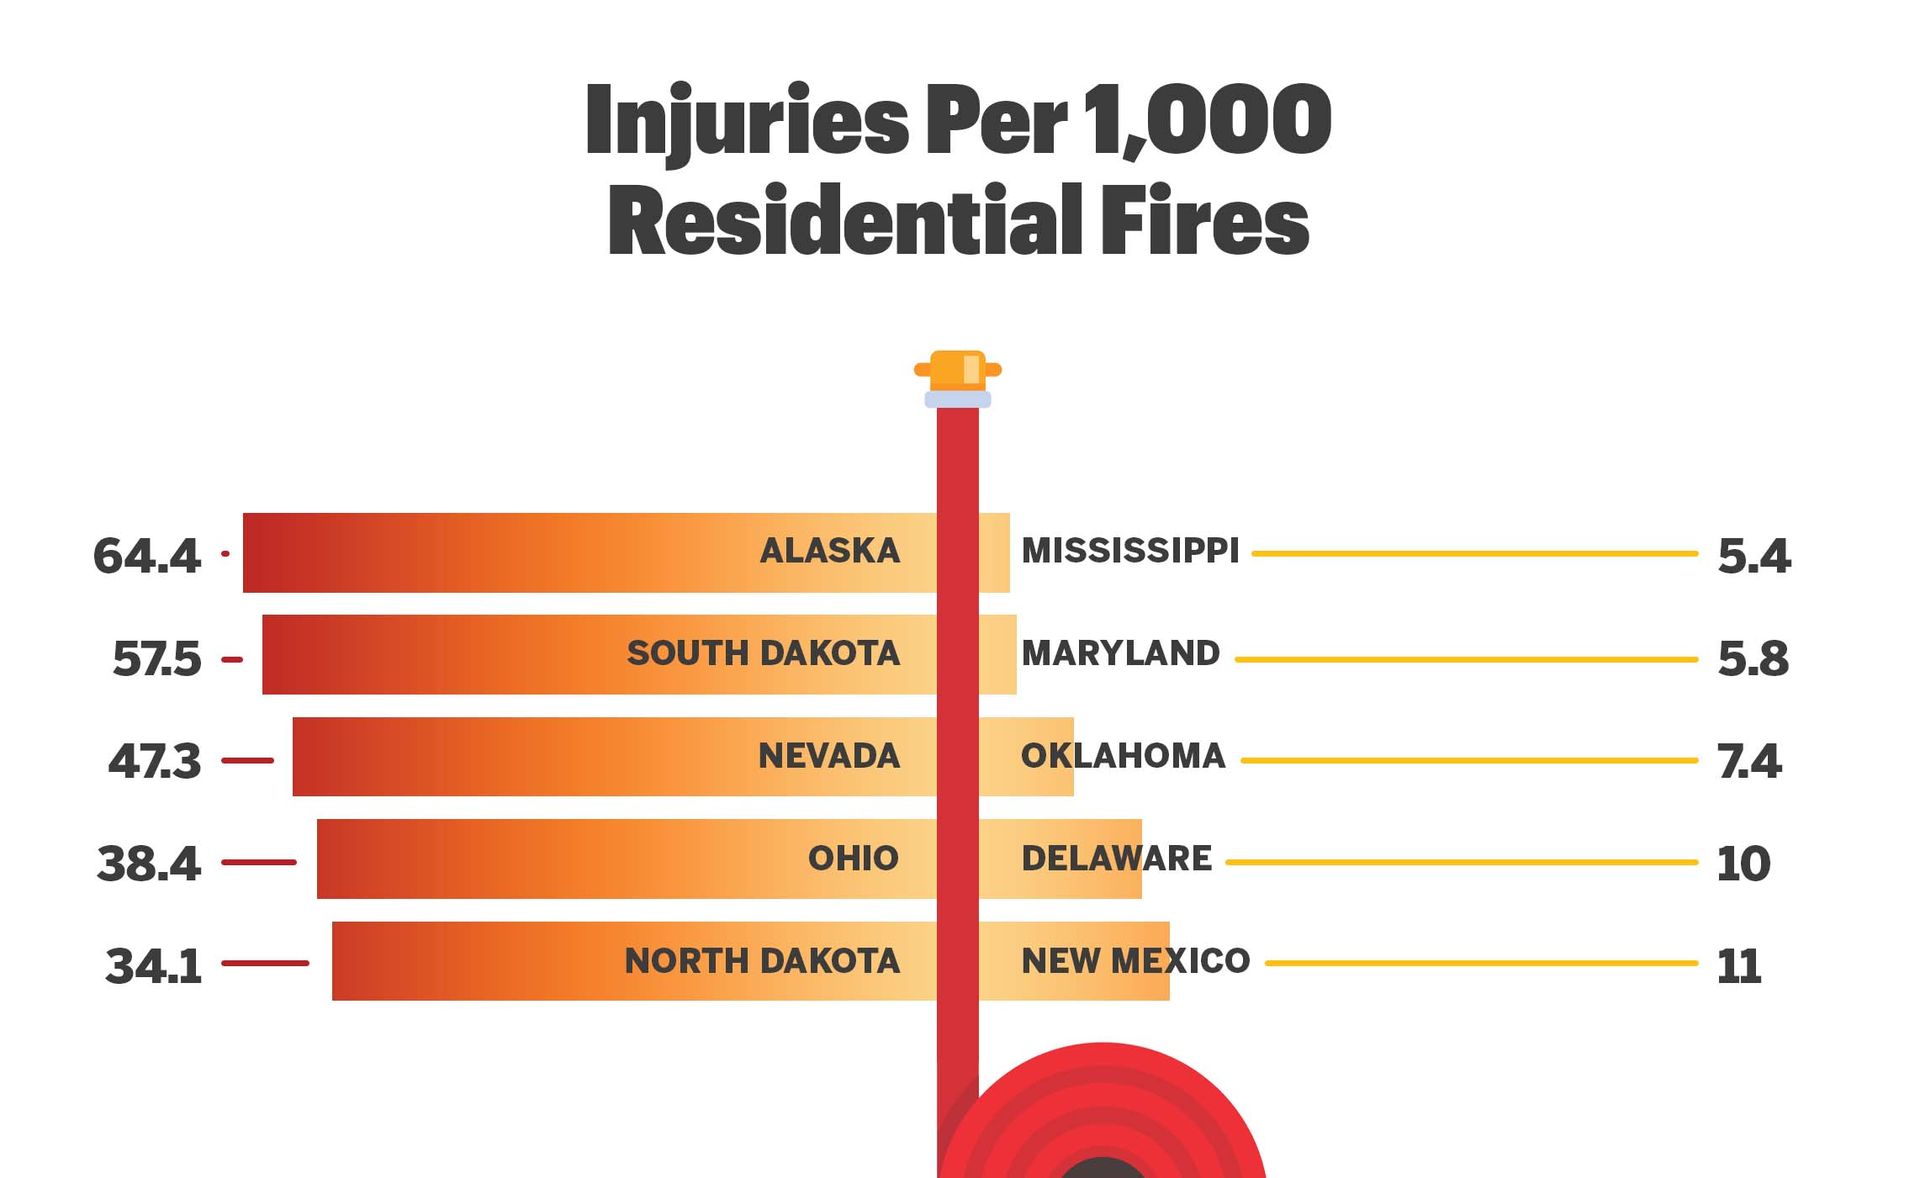
- Mississippi has the lowest injury rate (5.4), while Alaska has the highest (64.4).
- Hawaii has the highest percentage of professional firefighters in fire departments (75%), whereas Vermont has the lowest (1.5) percentage.
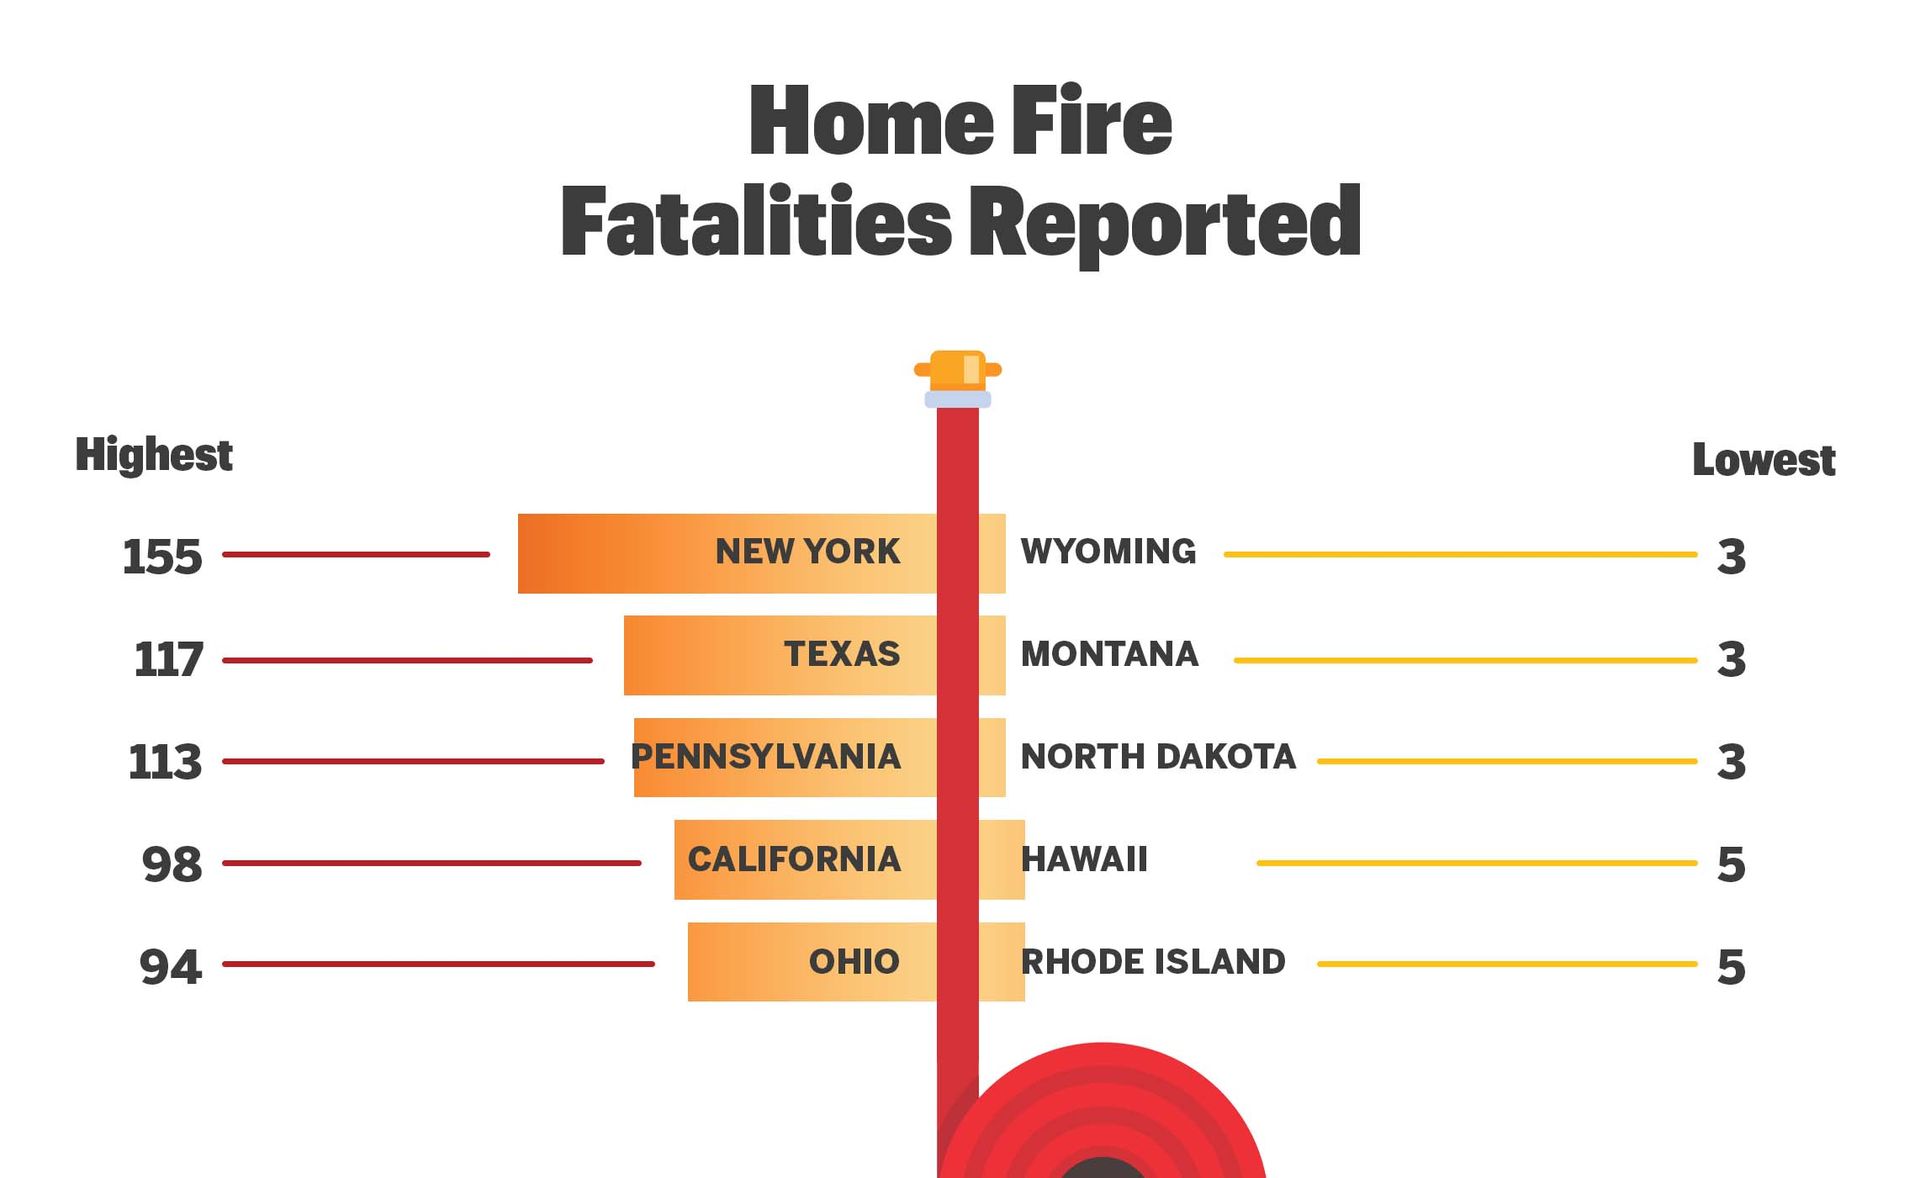
- The fewest fire fatalities (3) were reported in the news in North Dakota, while in New York, it was the highest (155).
- States like Rhode Island (0.9), Oregon (1.3), and New York (1.1) demonstrate effective fire prevention and emergency response measures.
- States such as Alaska (25.5), North Dakota (16.3), and Wyoming (14.3) face significant challenges, possibly due to geographic isolation, harsher climates, or limited resources.
- Hawaii (75%), New Jersey (39%), and Rhode Island (35.3%) show that a higher percentage of career fire departments correlates with better fire safety outcomes.
- States like Vermont (1.5%), Delaware (1.7%), and North Dakota (3.1%) rely heavily on volunteer fire departments, which may impact their overall fire safety scores.
- States like Mississippi (5.4) and Maryland (5.8) have low injury rates, suggesting efficient fire response and public safety measures.
- States like Alaska (64.4), South Dakota (57.5), and Nevada (47.3) have alarmingly high injury rates, indicating potential gaps in fire safety education and emergency response.
- New York (155) and Pennsylvania (113) report the highest number of fatalities, likely influenced by their large populations and urban setting.
- States with lower populations such as North Dakota (3) and Wyoming (3) report fewer fatalities but still face high death rates per 1,000 fires.
- New England: States like Rhode Island (90), Massachusetts (86.2), and Maine (81.7) generally score well, suggesting effective regional fire safety standards and practices.
- Midwest: States such as Iowa (67.3), Wisconsin (67.9), and Ohio (58.8) struggle more with fire safety, potentially due to a mix of urban and rural challenges.
- Southern States: There is a wide range, with Mississippi scoring relatively high (84.9) and Tennessee scoring low (60.9), indicating varied effectiveness of fire safety measures across the region.
Safest and Dangerous States for House Fire Safety in the USA 2024
10 Best States for House Fire Safety in the USA 2024
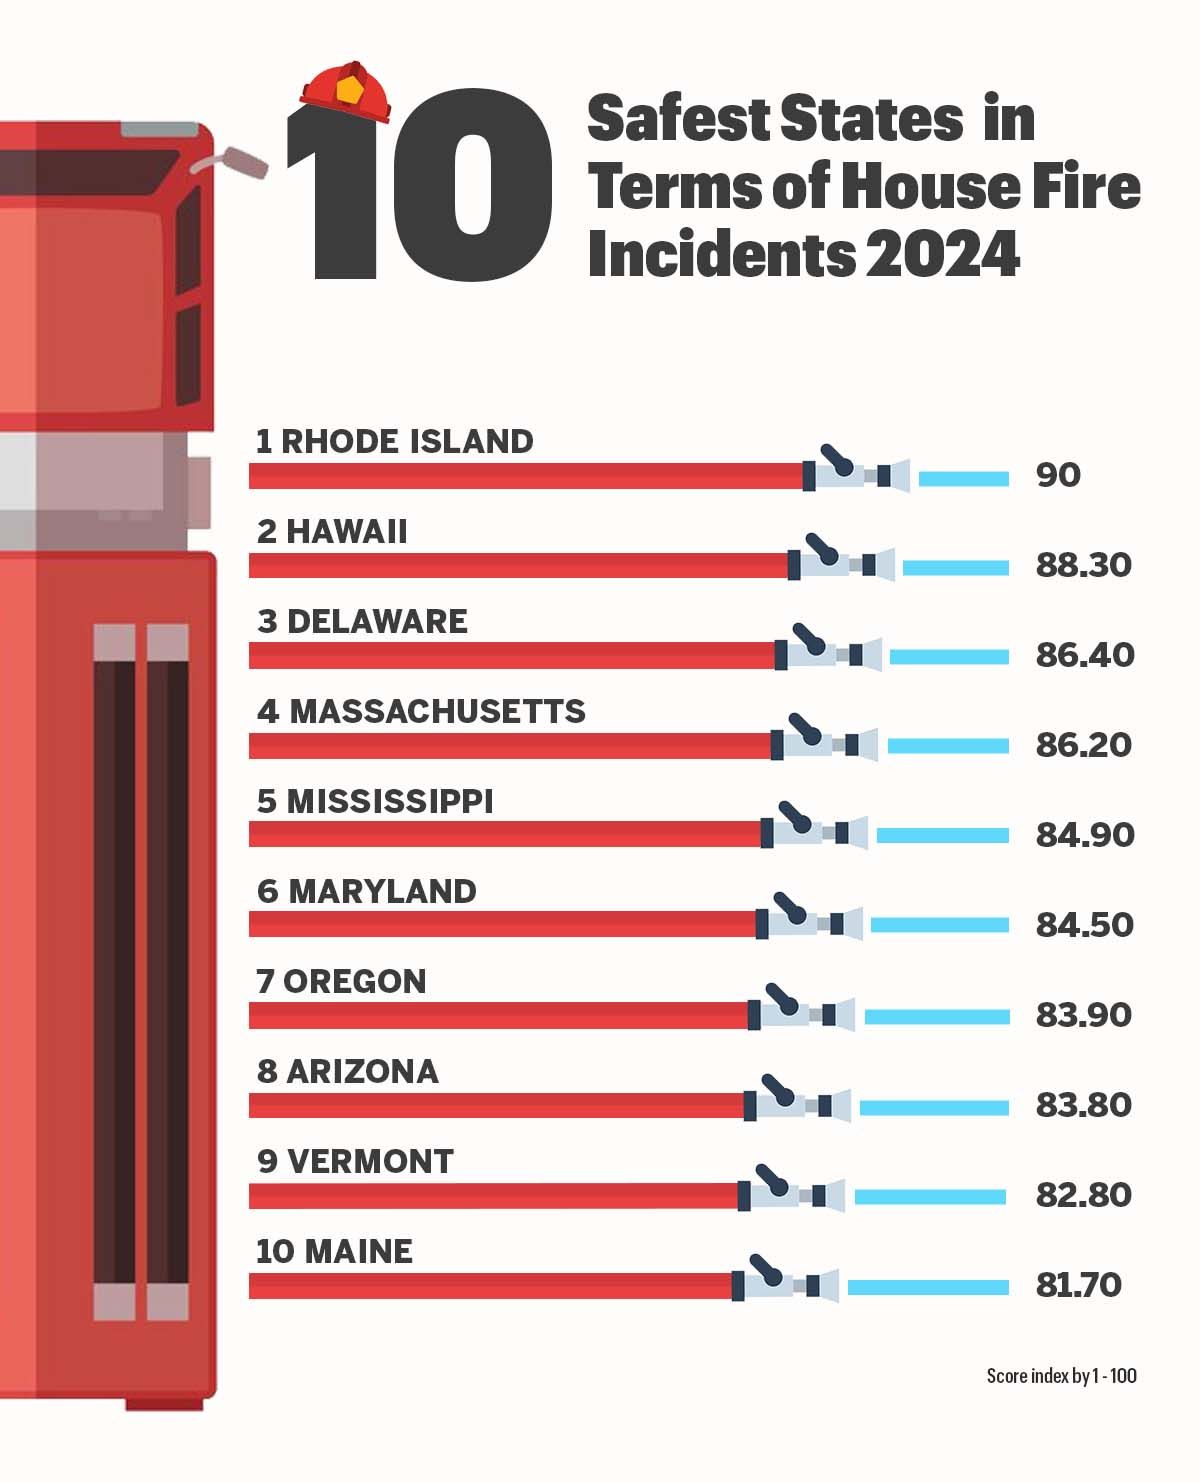
1. Rhode Island
Rhode Island ranks first in house fire safety, with the second-lowest death rate of 0.9 per 1,000 residential fires and a relatively low injury rate of 15.7 per 1,000 residential fires in the country as of 2022. With 35.3% of fire departments staffed by professional firefighters, the state has the third most efficient fire response capability.
With only five home fire fatalities reported in the news in 2023, Rhode Island appears to have a safe fire record. The state’s comprehensive fire safety measures and professional firefighting resources contribute to its top safety score of 90.
2. Hawaii
Hawaii closely follows, with a safety score of 88.3. The state has a low death rate (3.5 per 1,000 residential fires), likely due to the fact that its fire departments have the most professional firefighters (75%), which ensures quick response times. However, the state’s injury rate of 22.8 per 1,000 residential fires is slightly higher.
Like Rhode Island, Hawaii reported five home fire fatalities in 2023.
3. Delaware
Delaware comes in third with a safety score of 86.4. The state has a low death rate of 2.5 per 1,000 residential fires and a low injury rate of 10 per 1,000 fires. However, only 1.7% of fire departments are staffed by career firefighters. In 2023, Delaware reported 11 home fire fatalities.
4. Massachusetts
Massachusetts ranks fourth with a safety score of 86.2. The state has a low death (2.5) and injury rate (12.9) per 1,000 residential fires. This is likely due to 32% of fire departments being staffed by professional firefighters. In 2023, Massachusetts reported one of the highest home fire fatalities (33) among the top ten states for house fire safety.
5. Mississippi
Mississippi is fifth with a safety score of 84.9. The state has the second-highest death rate (4.2 per 1,000 residential fires) among the top ten states for house fire safety. The injury rate is, however, low at 5.4 per 1,000 fires. Fire departments here are staffed by 10.3% professional firefighters. Like Massachusetts, Mississippi also reported many home fire fatalities (32) in 2023.
6. Maryland
Maryland ranks sixth with a safety score of 84.5. Although the state had a low death (2.3) and injury rate (5.8) per 1,000 residential fires in 2022, in 2023, Maryland news outlets reported the highest number of home fire fatalities (54) among the top ten states for house fire safety. There may be a correlation between the high number of fatalities reported to the lower percentage (6.5%) of fire departments that are staffed by career-type firefighters in Maryland.
7. Oregon
Oregon is seventh in safety score with 83.9. The state has a low death (1.3) and injury rate (18.4) per 1,000 residential fires. Fire departments here are staffed by 5.9% professional firefighters. Oregon reported 23 home fire fatalities in 2023.
8. Arizona
Arizona is placed in the eighth position with a safety score of 83.8. The state has a low death rate of 2.9 per 1,000 residential fires and a low injury rate of 17.9 per 1,000 fires. About 31.5% of fire departments are staffed by professional firefighters, ensuring effective response times. However, still, Arizona reported 33 home fire fatalities in 2023.
9. Vermont
Vermont ranks ninth with a safety score of 82.8. The state has the highest death rate (4.9 per 1,000 residential fires) among the top ten states for house fire safety. The injury rate is among the lowest at 13.1 per 1,000 fires. Vermont reported 7 home fire fatalities in 2023. Only 1.5% of fire departments are staffed by career-type firefighters.
10. Maine
Maine rounds out the top ten states with a safety score of 81.7. Like most of the top states for fire safety, Maine too has a low death rate of 4 per 1,000 residential fires and a comparatively low injury rate of 15.9 per 1,000 fires as of 2022. Only about 3.6% of fire departments are staffed by professional firefighters. Maine reported 21 home fire fatalities in 2023.
10 Dangerous States for House Fire Safety in the USA 2024
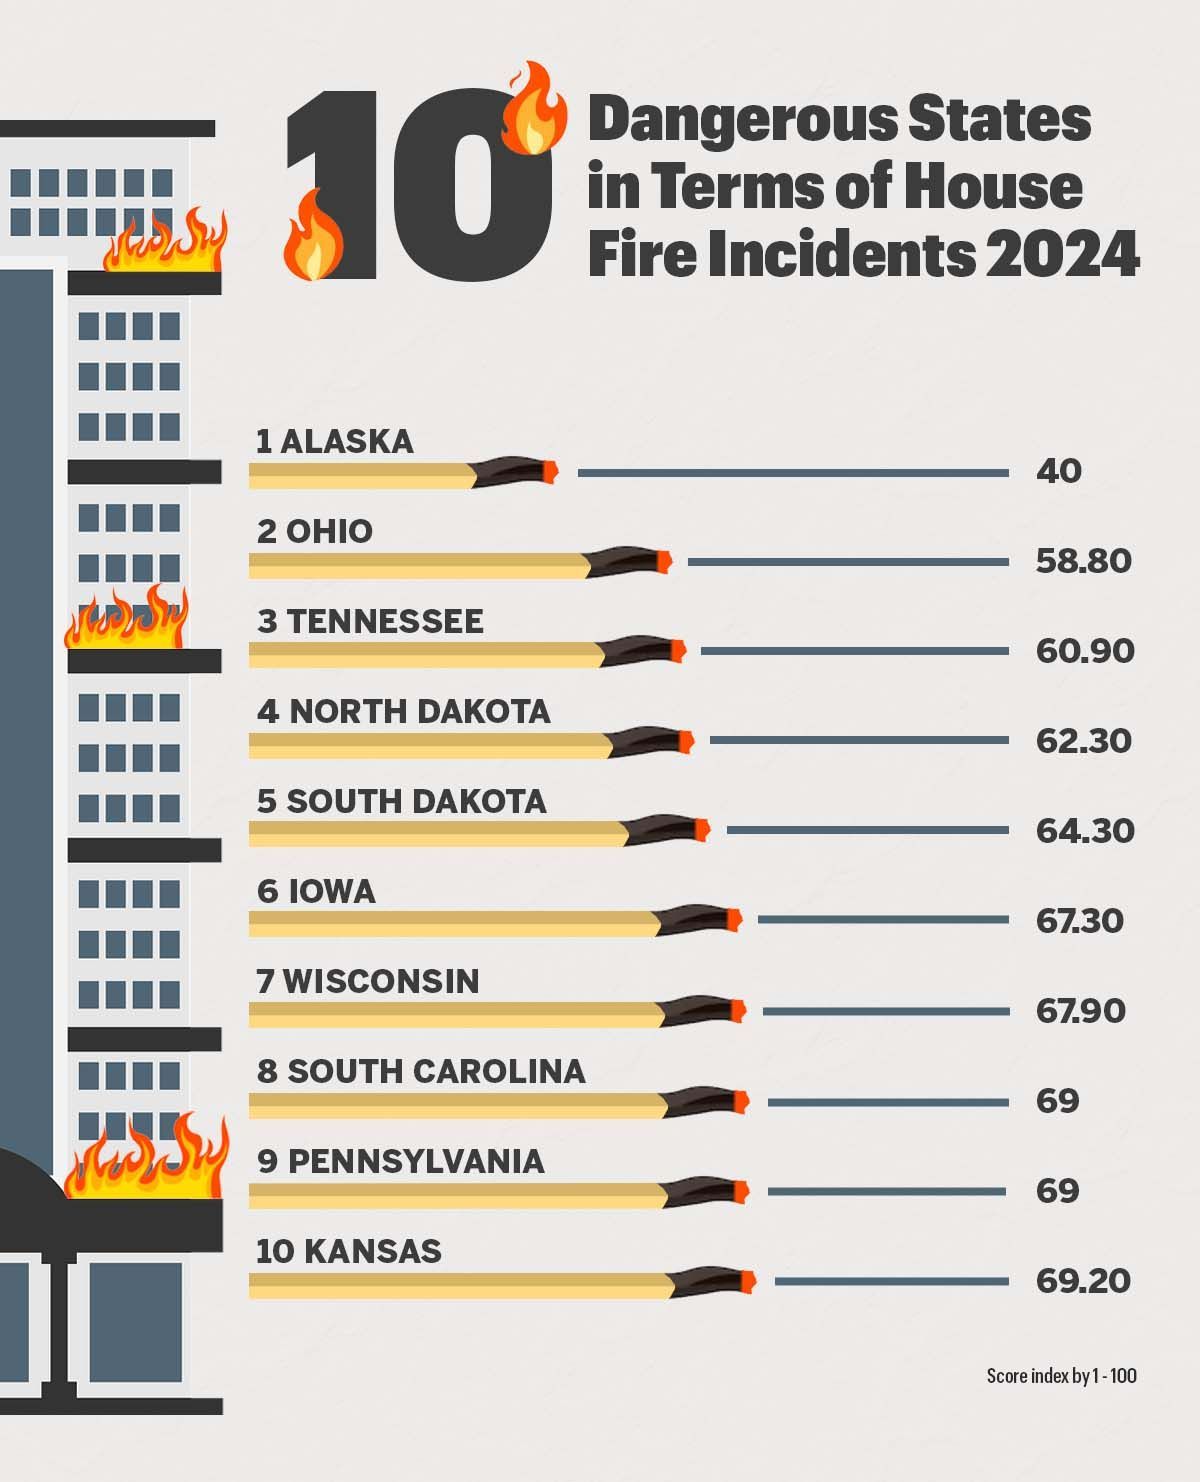
1. Alaska
Alaska ranks as the worst state for house fire safety, with a final safety score of 40. The state has the highest death rate (25.5 per 1,000 residential fires) and the highest injury rate (64.4 per 1,000 fires) across the country. Despite having 10.4% of its fire departments staffed by career firefighters, Alaska reported 15 home fire fatalities in 2023. The state's challenges include harsh weather, remote locations, and limited professional firefighting resources, contributing to its poor fire safety performance.
2. Ohio
Ohio ranks second worst with a safety score of 58.8. The state has a high death rate of 11.3 per 1,000 residential fires. The injury rate is also high, at 38.4 per 1,000 fires—some 12.8% of fire departments are staffed by career firefighters. Ohio reported 94 home fire fatalities in 2023, one of the highest that year. These high fatality and injury rates, combined with a relatively low percentage of professional fire departments, contribute to Ohio’s low safety score.
3. Tennessee
Tennessee ranks third worst with a safety score of 60.9. The state has a high death rate of 13.5 per 1,000 residential fires, suggesting a significant risk of fatalities. The injury rate is 24.8 per 1,000 fires. With only 8.3% of fire departments staffed by career firefighters, Tennessee reported 93 home fire fatalities in 2023, also one of the highest that year. The state's high fatality rate and limited professional firefighting resources are key factors in its poor fire safety ranking.
4. North Dakota
North Dakota ranks fourth worst, with a safety score of 62.3. The state has high death (16.3 per 1,000 residential fires) and injury rates (34.1 per 1,000 fires). However, the state news reported only three home fire fatalities in 2023. Besides, only 3.1% of its fire departments are staffed by career firefighters.
5. South Dakota
South Dakota ranks fifth worst, with a safety score of 64.3. While the state’s death rate (6.6 per 1,000 residential fires) is on the moderate side, its injury rate (57.5 per 1,000 fires) is the second highest in the country. South Dakota reported 10 home fire fatalities in 2023. The state has only 3.1% of fire departments staffed by career firefighters.
6. Iowa
Iowa ranks sixth worst with a safety score of 67.3. The state’s death rate (11.3) and injury rate (30.2) per 1,000 residential fires are high. Iowa reported 27 home fire fatalities in 2023. This could be attributed to the fact that only 3.3% of fire departments are staffed by career firefighters.
7. Wisconsin
Wisconsin ranks seventh worst, with a safety score of 67.9. Like Iowa, Wisconsin has a high death (11.1) and injury rate (24.6) per 1,000 residential fires. About 5.9% of its fire departments are staffed by career firefighters. Wisconsin reported 47 home fire fatalities in 2023.
8. South Carolina
South Carolina ranks eighth worst with a safety score of 69. The state has a death rate of 10 per 1,000 residential fires and an injury rate of 24.2 per 1,000 fires. With 9.8% of fire departments staffed by career firefighters, South Carolina reported 55 home fire fatalities in 2023.
9. Pennsylvania
Pennsylvania ranks ninth-worst with a safety score of 69. The state has a death rate of 7.6 per 1,000 residential fires and an injury rate of 14.7 per 1,000 fires. Only 2.6% of its fire departments are staffed by career firefighters. Pennsylvania reported 113 home fire fatalities in 2023, the third-highest among all states.
10. Kansas
Kansas ranks tenth worst with a safety score of 69.2. The state has a death rate of 12.2 per 1,000 residential fires and an injury rate of 23.5 per 1,000 fires. With 6.2% of fire departments staffed by career firefighters, Kansas reported 25 home fire fatalities in 2023.
Deaths Per 1,000 Residential Fires
Injuries Per 1,000 Residential Fires

Damaged Home? Get a Fair Price Today
Not all buyers are interested in fire-damaged home, but we can help find someone who is. Request a cash offer from Fire Cash Buyer's extensive investor network and work with one of our home consultants to move forward.
Career Type Fire Dept Percentage

Home Fire Fatalities Reported
Conclusion
Key takeaways from this study include the critical role of professional firefighting resources in improving fire safety outcomes and the importance of effective fire prevention strategies. States with a higher percentage of career fire departments tend to have better safety scores, suggesting that professional expertise and quick response times are crucial in mitigating fire-related incidents.
Rhode Island stands out with the highest safety score due to low death and injury rates and a substantial proportion of professional firefighters. This demonstrates the effectiveness of robust fire prevention measures and professional firefighting capabilities. On the other end of the spectrum, Alaska's low safety score highlights significant challenges, including high mortality and injury rates despite having a reasonable percentage of career fire departments.
Methodology:
In our analysis, we thoroughly examined all 50 U.S. states based on a set of 4 criteria to rank which state would be the safest in terms of residential fire safety. Each criterion scored 40 to 100, indicating its relative importance in the assessment. We applied a normalization process to ensure a fair and comparable analysis across all criteria. This process standardized the scores for each criterion to a common range while preserving their relative differences.
After normalizing the scores, we calculated each state's overall performance. To achieve this, we aggregated the individual scores, considering their respective weights based on their importance in the assessment. By applying appropriate weights to the normalized scores, we generated a composite score for each state. The final composite score, ranging from 40 to 90 (for familiar interpretation), provides a statistically meaningful evaluation of each state's overall fire safety performance.
We have retained the individual scores for each criterion in our dataset rather than storing only the feature values.
The criteria for evaluation are as follows:
Deaths per 1,000 Fires (2022)
- The number of fatalities per 1,000 residential fires.
This metric indicates the severity of human loss caused by fires, measuring fire-related mortality risk in each state. Data is collected from the US Fire Administration.
Injuries per 1,000 Fires (2022)
- The number of injuries per 1,000 residential fires.
This metric gauges the non-fatal but serious impacts of fires, reflecting the overall safety and effectiveness of fire response and prevention efforts. Data is collected from the US Fire Administration.
Career Type Fire Dept Percentage (2024)
- The percentage of fire departments that are staffed by career (professional) firefighters.
This represents the level of professional firefighting resources, which can influence response times and the effectiveness of firefighting efforts. Data is from the US Fire Administration.
Home Fire Fatalities Reported (2023)
- The total number of home fire fatalities reported through daily internet searches of U.S. news media reports (Monday-Friday). This information is preliminary and gathered within 24-48 hours after a fatal fire.
This metric provides a raw count of fire deaths, offering a direct measure of the fire safety environment in each state. Should be viewed only as a preliminary awareness score because fires require investigations that can take weeks or months to complete. Data is from the US Fire Administration.
Methodology: Further Details
How the weights are distributed
The weights assigned to each criterion reflect their importance in assessing a state's fire safety. Negative weights highlight undesirable outcomes, such as higher death and injury rates, which are crucial for evaluating the overall fire safety effectiveness. A positive weight is given to the percentage of career firefighters, emphasizing the importance of professional firefighting resources.
Higher weights are given to metrics with more significant impacts on fire safety, ensuring a balanced evaluation of factors contributing to a safe environment for residents.
- The actual scores are padded to 40-80 to get more realistic-looking scores.
- Weights for each feature are as below and are taken to be a bit more subjective:
| No. | Feature | Weight |
|---|---|---|
| 1 | Deaths per 1,000 Fires | -0.4 |
| 2 | Injuries per 1,000 Fires | -0.3 |
| 3 | Career Type Fire Dept Percentage | 0.1 |
| 4 | Home Fire Fatalities Reported | -0.2 |