
Wildfires and Home Insurance Premiums: An In-Depth Analysis of Rising Risks and Costs in the United States
November 1, 2024
Joel Efosa
Joel efosa is an experienced NATIONWIDE fire damage real estate investor. As owner of fire cash buyer, my goal is to provide fire victims with more options wether its rehab, sell or financial help.
He’s been featured on multiple publications including
Realtor, Yahoo Finance, Business Insider, Nasdaq, MSN, Fox, Go Banking Rates, Homelight
At Fire Cash Buyer, we promote strict editorial integrity in each of our posts.
Table of Contents
Background and Purpose of the Report
Overview of Wildfires in the United States
2. Trends in Wildfire Occurrence Over Time
Increasing Acres Burned Annually
Table 1: Average Acres Burned Annually by Decade-
Fluctuations in the Number of Wildfires
Table 2: Average Acres Burned per Fire
3. Economic Impact of Wildfires
Table 3.1: Costliest Wildfires in U.S.
4. Geographic Distribution of Wildfire Risk
States with the Highest Wildfire Risk
Table 4: Top 3 States by Number of High-Risk Homes
State-Specific Data and Trends
5. Impact on Home Insurance Premiums
Rising Insurance Premiums in High-Risk Areas
Insurance Market Withdrawal and Challenges
State Interventions and Insurance Solutions
6. Environmental Justice Impact
Disproportionate Effects on Vulnerable Communities
Current Wildfire Activity (2024)
[2024] Wildfire Status Overview
State-by-State Current Activity
Chart 4: Active Fires and Affected Acreage by State (As of October 25, 2024)
7. Climate Change and Wildfires
Influence of Climate Change on Wildfire Frequency and Severity
How Climate Change is Increasing Fires and Carbon Emissions
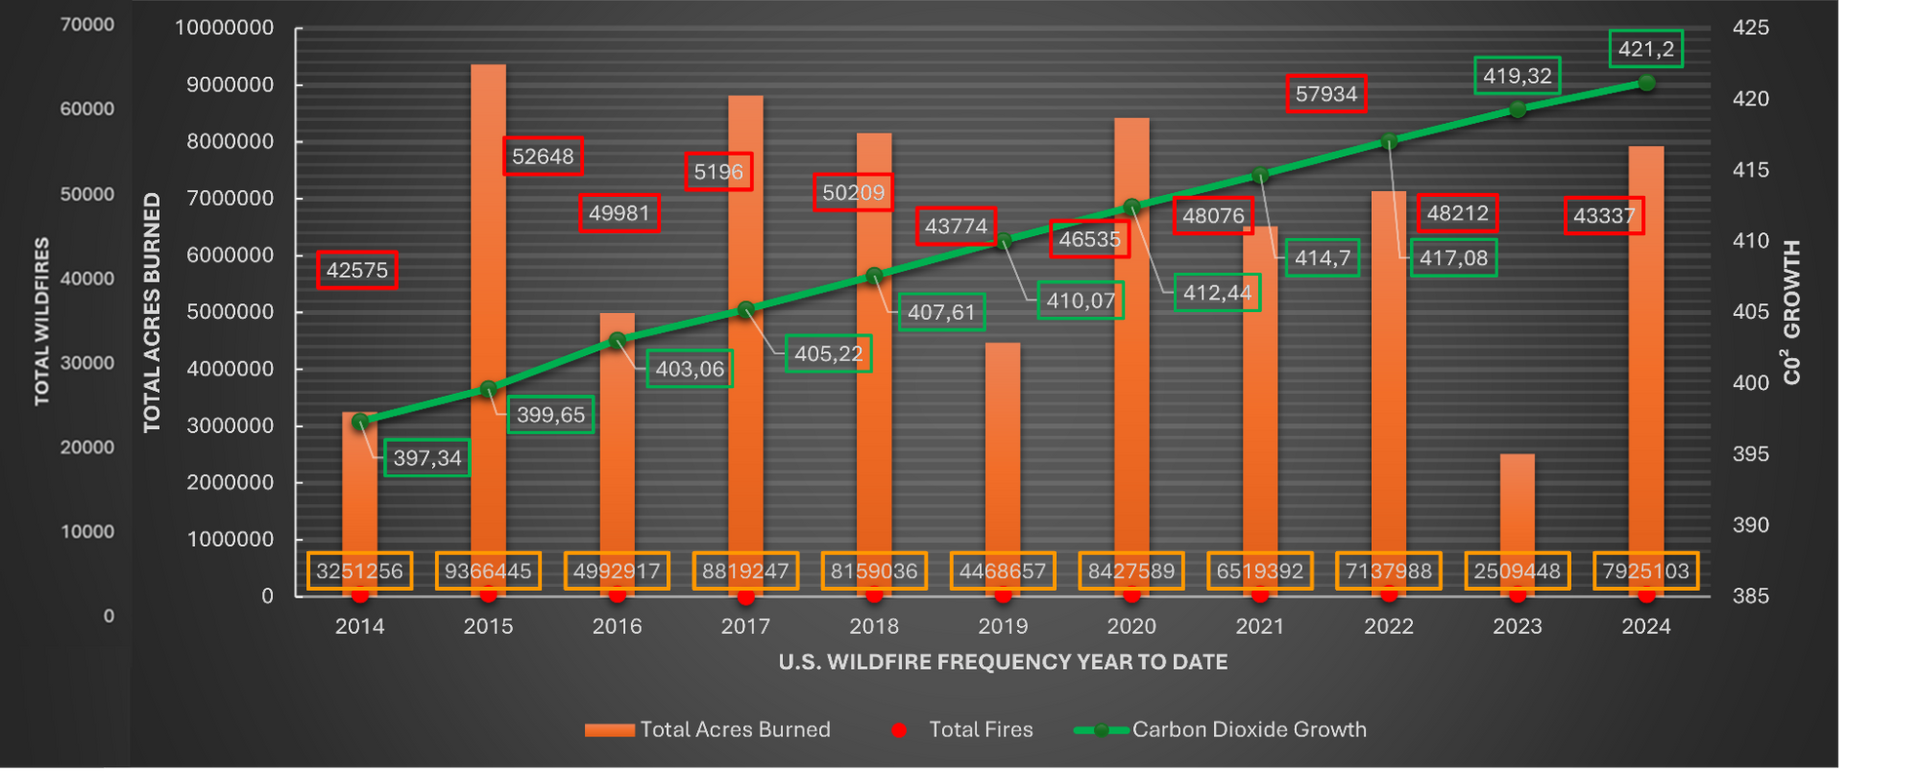
Chart 5: Climate Change Impact on WIldfire
Economic Impact of Climate-Related Disasters
8. Policy Responses and Management Strategies
Federal and State Responses to Wildfires
Implications for Homeowners and Insurers
Executive Summary
The United States is witnessing an alarming escalation in wildfire activity, leading to significant economic impacts and profound implications for the home insurance industry.
This report provides a comprehensive analysis of the trends in wildfire occurrences, their economic consequences, and the resultant rise in home insurance premiums, particularly in high-risk areas.
Key findings include:
- Increasing Acres Burned Annually: The average annual acres burned by wildfires in the U.S. increased from 2.5 million acres in the 1980s to 7.9 million acres in 2024 [1, 1.1].
- Economic Impact: Wildfires caused over $21.1 billion in damages between 2021 and 2023 [2], with insurance losses reaching $61 billion in 2024 [3].
- Rising Insurance Premiums: Home insurance premiums in high-risk states like Nebraska and Florida are over 140% above the national average of $2,285, costing homeowners $5,655 and $5,527 respectively per year [4].
- Insurance Market Challenges: Major insurers such as State Farm and Allstate have ceased accepting new homeowners’ insurance applications in California due to wildfire risks [1].
- Disproportionate Impact on Vulnerable Communities: Majority Hispanic, Native American, or Black census tracts experience 50% greater vulnerability to wildfires compared to majority white tracts [5].
The escalating frequency and severity of wildfires, exacerbated by climate change, underscore a critical need for effective risk management, policy interventions, and strategies to support both homeowners and insurers.
Introduction
Background and Purpose of the Report
Wildfires have become an increasingly prevalent and destructive force in the United States, posing significant challenges to homeowners, insurers, and policymakers.
Approximately 77% of U.S. homes are financed with mortgages requiring insurance [6], underscoring the critical role of home insurance in safeguarding financial stability. In 2024, the U.S. experienced 46,437 wildfires [1.1], highlighting the urgency of addressing the impacts of these natural disasters.
This report aims to analyse the trends in wildfire occurrences, examine the economic implications, assess the impact on home insurance premiums, and explore policy responses to mitigate risks. By understanding the interconnectedness of wildfires and the financial burden on homeowners and insurers, stakeholders can develop informed strategies to enhance resilience against this growing threat.
Overview of Wildfires in the United States
Wildfires in the United States are predominantly caused by human activities, with approximately 85% of wildfires resulting from actions such as unattended campfires, debris burning, equipment use, discarded cigarettes, and arson [8].
The annual number of wildfires fluctuates, but the overall trend indicates increasing severity. In 2024, wildfires affected 7.9 million acres, with a total of 46,437 wildfires recorded [1.1].
Historical data shows a significant escalation in the average acres burned annually:
- 1983-1989: 2.5 million acres
- 1990-1999: 3.3 million acres
- 2000-2009: 6.9 million acres
- 2010-2019: 6.8 million acres
- 2020-2022: 8.3 million acres [1]
- 2023-2024: 1.5 billion acres [1.1]
Factors such as climate change, drought conditions, and changes in land management practices contribute to the increasing size and intensity of wildfires, setting the stage for significant economic and insurance challenges.
Trends in Wildfire Occurrence Over Time
Increasing Acres Burned Annually
The United States has witnessed a clear upward trend in the total acres burned by wildfires annually.
Data indicates that the average acres burned annually increased from 2.5 million acres in the 1980s to 7.9 million acres in 2024 [1, 1.1]. In 2024 (Year to Date), wildfires burned 7,984,032 acres across the country [7, 1.1 ].
Table 1: Average Acres Burned Annually by Decade-
| Decade | Average Acres Burned |
|---|---|
| 1983-1989 | 2.5 million |
| 1990-1999 | 3.3 million |
| 2000-2009 | 6.9 million |
| 2010-2019 | 6.8 million |
| 2020-2022 | 8.3 million |
| 2022-2024 | 17,7 million |
Fluctuations in the Number of Wildfires
While the total acres burned have increased, the number of wildfires varies significantly from year to year. For instance, 1996 and 2006 each recorded over 96,000 fires, whereas 2022 saw 7,223,528 fires [7] and 2024 currently has 46,437 fires. This fluctuation indicates that although the number of fires does not consistently rise, the fires themselves are burning more area on average.
Increasing Average Fire Size
The average size of wildfires has grown over time, indicating more severe and impactful fires. In 1983, the average wildfire burned approximately 72.6 acres, compared to 144.41 acres in 2024 [7].
Table 2: Average Acres Burned per Fire
| Year | Total Fires | Total Acres Burned | Average Acres per Fire |
|---|---|---|---|
| 1983 | 18,229 | 1,323,666 | 72.6 |
| 2022 | 68,988 | 7,577,175 | 109.8 |
| 2024 | 46,437 | 7,984,032 | 144.41 |
Source: 7
Factors contributing to larger fire sizes include prolonged droughts, increased fuel loads, and more extreme weather conditions.
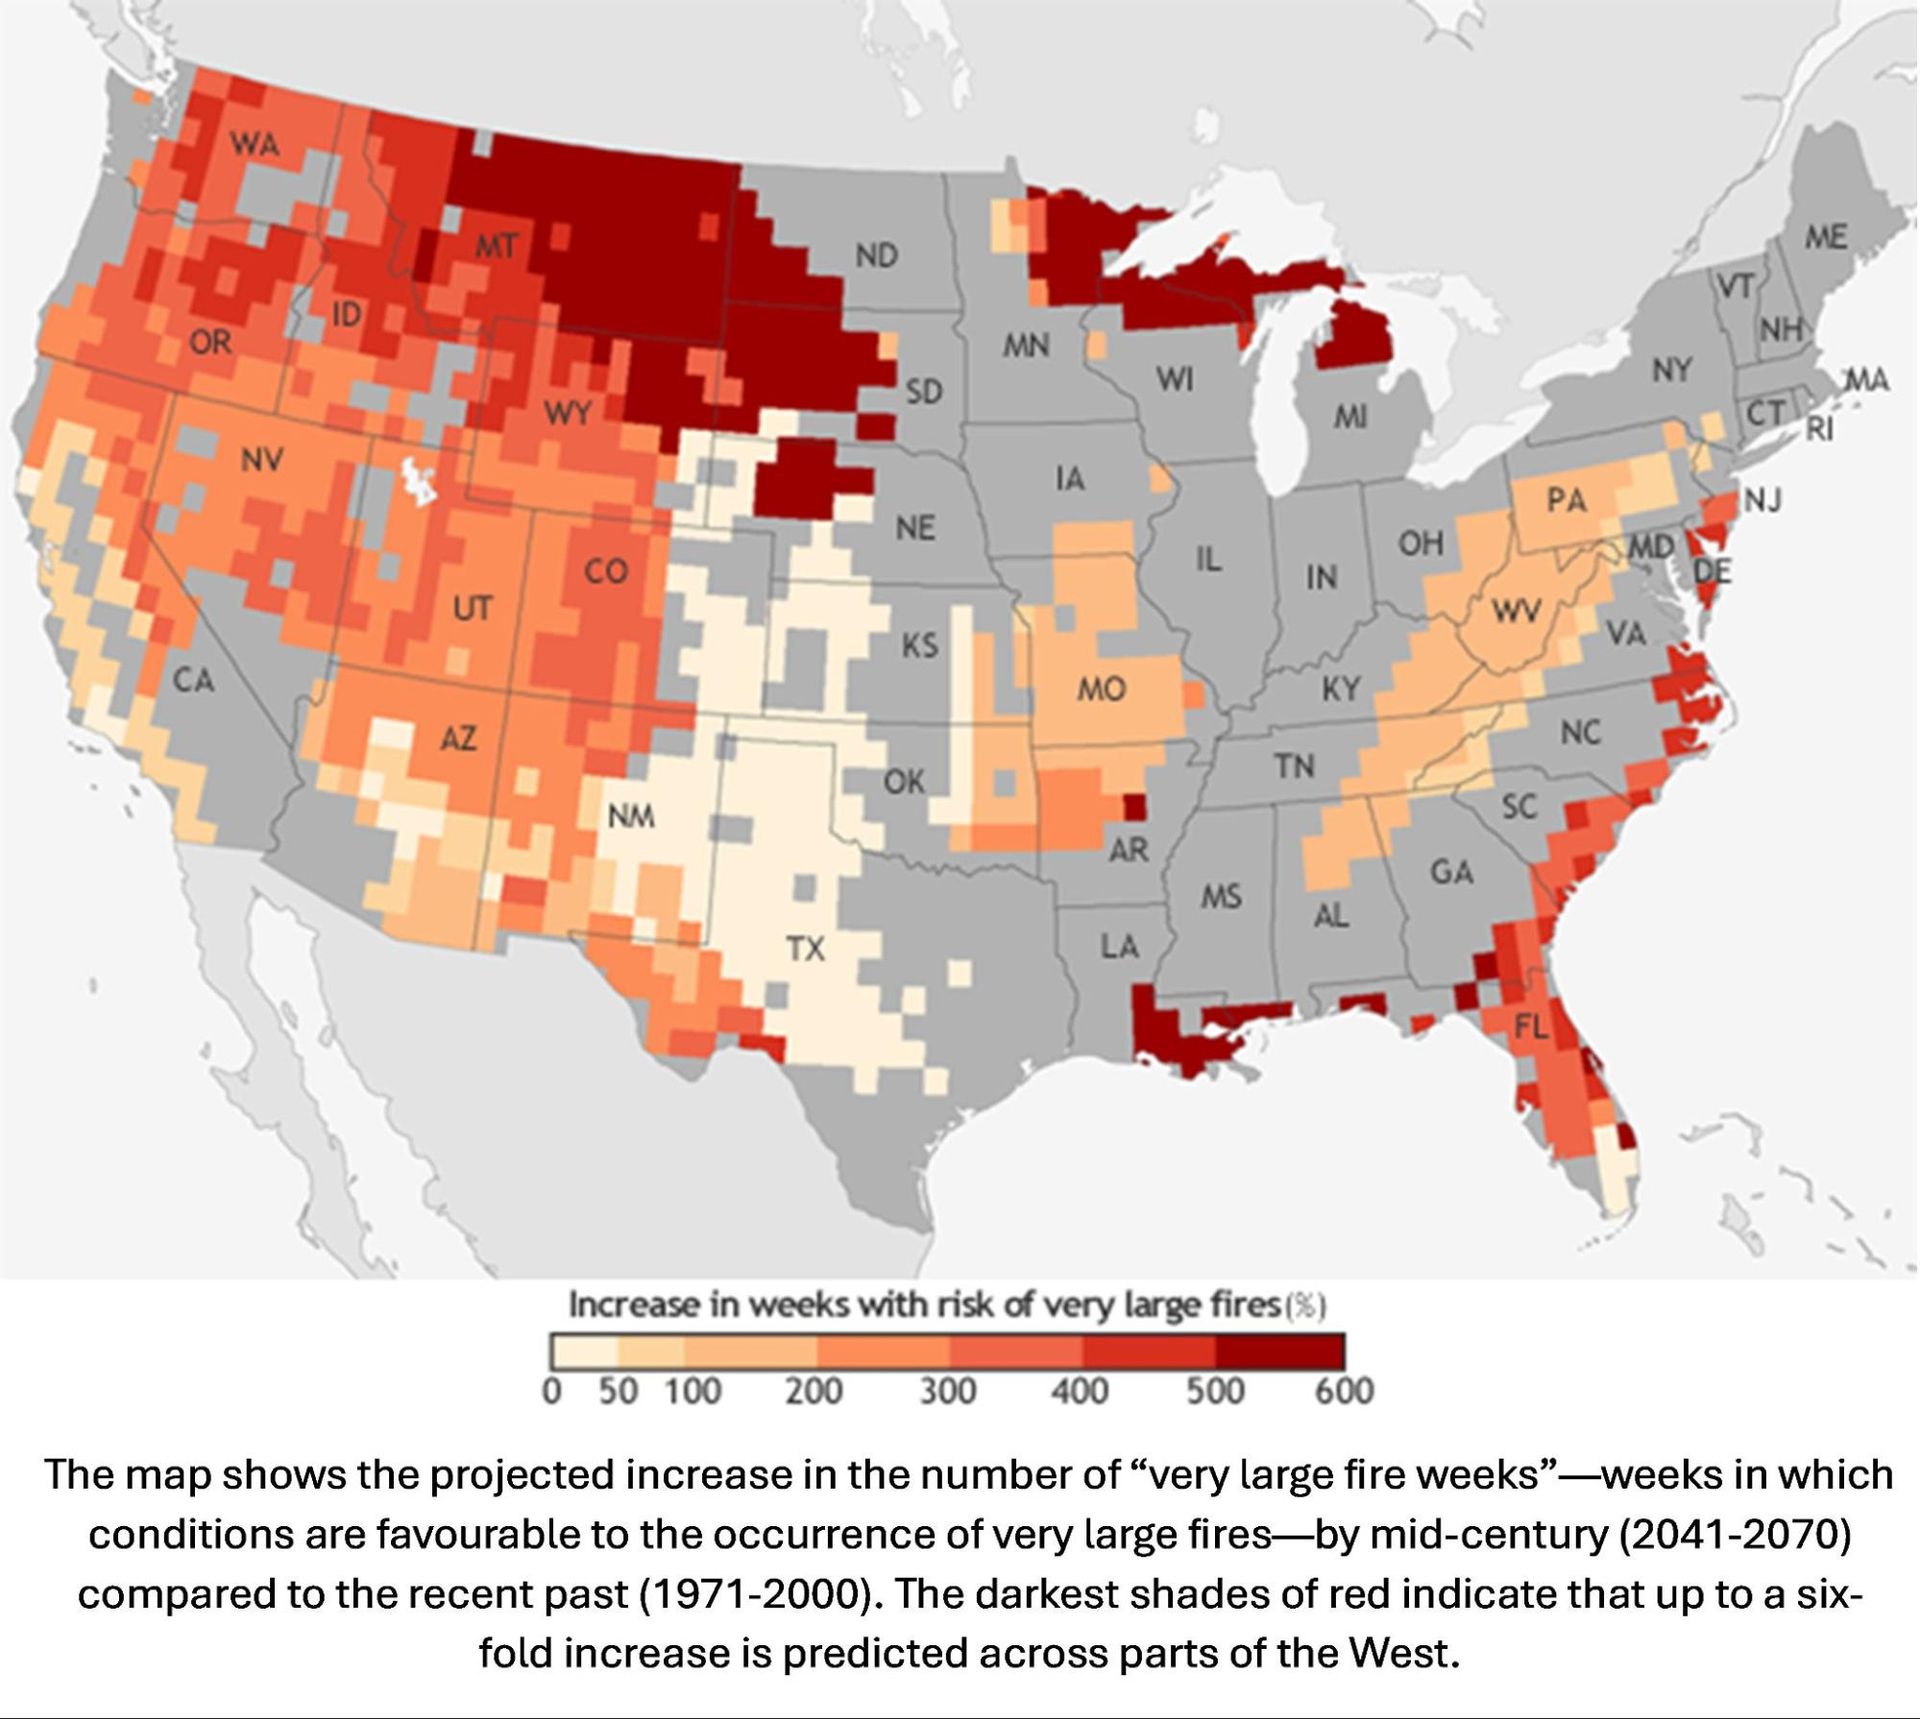
Chart 2: Projection Increase of Wildfires
Economic Impact of Wildfires
Rising Financial Costs
The economic costs associated with wildfires have escalated significantly, impacting governments, insurers, and homeowners. Between 2022 and 2023, wildfires caused over $3.2 billion in damages in the United States [2]. In 2024, wildfires, drought, and heatwaves resulted in $89.6 billion in economic losses and $9.1 billion in insurance losses [3].
The federal government's firefighting costs have also increased, with an average of $2.5 billion annually spent on fire suppression between 2016-2020 [9] and currently in 2024 it is discussed at $4.2 Billion [9.1]
Most Destructive Wildfires
Recent years have seen some of the most destructive wildfires in U.S. history. The Camp Fire (2018) in California resulted in $16.5 billion in damages, destroyed 18,804 structures, and caused 86 fatalities [10, 10.5].
Similarly, the Tubbs Fire (2017) caused $11.05 billion in damages and destroyed 5,636 structures [10, 10.5].
Table 3.1: Costliest Wildfires in U.S.
Geographic Distribution of Wildfire Risk
States with the Highest Wildfire Risk
Wildfire risk is concentrated in certain states due to climatic and environmental factors.
California tops the list with over 2 million homes at high or extreme risk, constituting 15% of the state's homes [11]. Texas and Colorado follow, with 717,800 and 373,900 high-risk homes respectively.
Table 4: Top 3 States by Number of High-Risk Homes
| State | High/Extreme Risk Homes | Percentage of State Homes |
|---|---|---|
| California | 2,040,600 | 15% |
| Texas | 717,800 | 7% |
| Colorado | 373,900 | 17% |
Source:
11
State-Specific Data and Trends
California continues to experience severe wildfires. In 2021, the state witnessed 2.6 million acres burned, 3,629 structures damaged or destroyed, and 3 fatalities [12]. In 2024, while the acres burned decreased to 1,014,375, the number of fatalities increased only 1 so far [13].
Texas also faces significant wildfire activity, with 65 fires currently burning 1,064,187 acres in 2024 October [7].
Impact on Home Insurance Premiums
Rising Insurance Premiums in High-Risk Areas
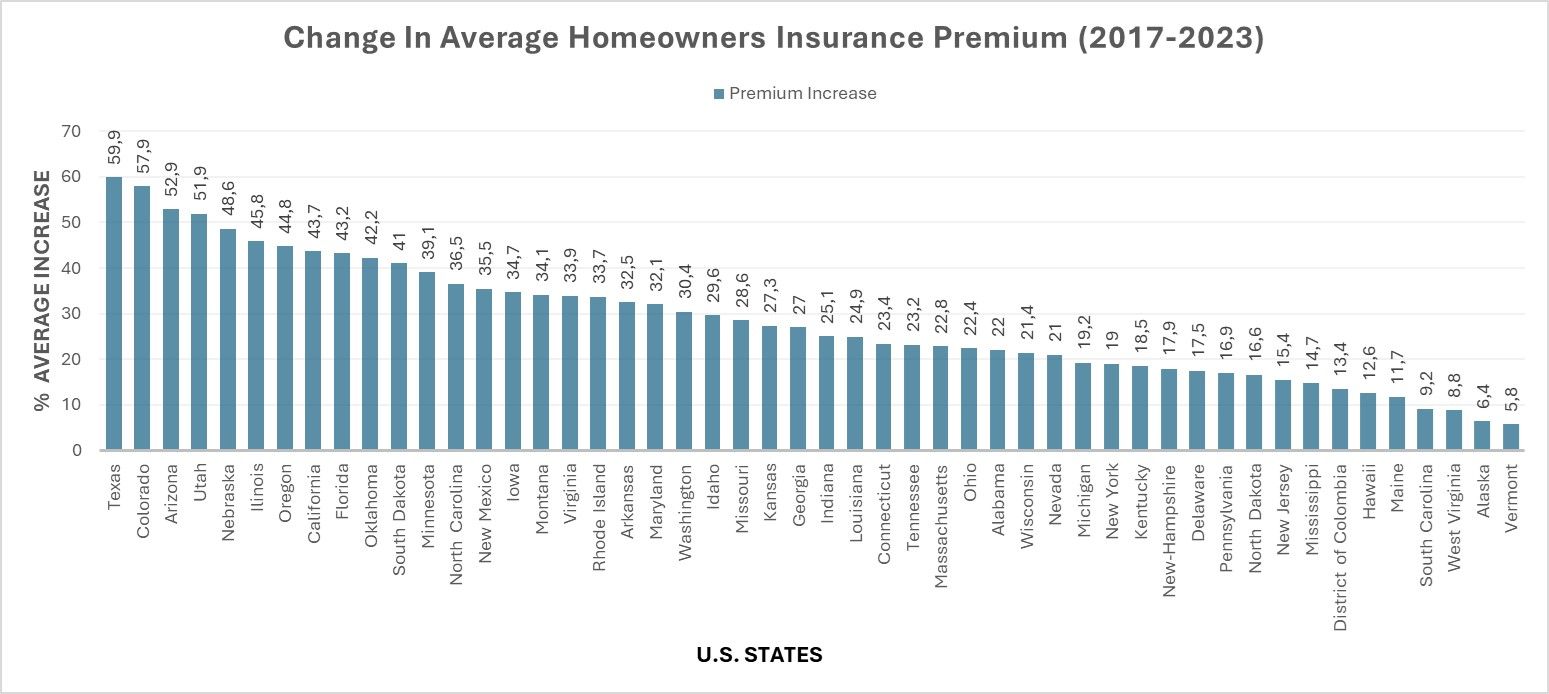
Home insurance premiums have risen sharply in states with increased wildfire risk. The national average annual premium is $2,285 for $300,000 in dwelling coverage [4].
However, in Nebraska, the average premium is $5,655, which is 147% above the national average, and in Florida, it's $5,527, 142% above the national average [4].
Homeowners with poor credit also face higher insurance costs, paying 92% more than those with excellent credit [4].
Insurance Market Withdrawal and Challenges
Insurers are responding to increased wildfire risks by withdrawing from high-risk markets. State Farm and Allstate have ceased accepting new homeowners insurance applications in California due to wildfire risks [1].
This trend has led to decreased availability of homeowners insurance in wildfire-prone areas, affecting homeowners' ability to obtain adequate coverage.
State Interventions and Insurance Solutions
To address insurance availability issues, states have introduced programs like California's FAIR Plan, a last-resort insurance option established in 2020. As of 2022, 272,846 homes were enrolled in the FAIR Plan in to this day [1].
Similarly, Florida passed Senate Bill 2-A in 2022 to stabilize the homeowners insurance market [4].
Chart 3: Change in Insurance premium (2017-2023)- (2024 still in process)
Environmental Justice Impact
Disproportionate Effects on Vulnerable Communities
Wildfires disproportionately affect minority and low-income communities. Majority Hispanic, Native American, or Black census tracts experience 50% greater vulnerability to wildfires compared to majority white tracts [5]. Native American tribal communities face a 47.7% increased risk from wildfires and other climate-related adversities [14].
Current Wildfire Activity (2024)
[2024] Wildfire Status Overview
As of October 25, 2024, the United States continues to experience significant wildfire activity. The National Preparedness Level is at 3, more than 16 active large wildfires burning over 1,112,048 acres [15, 16]. Approximately 5,200 wildland firefighters and support personnel are deployed nationwide [15, 16].
Year-to-date in 2024, there have been 45,119 fires, burning a total of 7,953,533 acres [15].
State-by-State Current Activity
Wildfire activity varies across states, with some experiencing more significant impacts.
Chart 4: Active Fires and Affected Acreage by State (As of October 25, 2024)
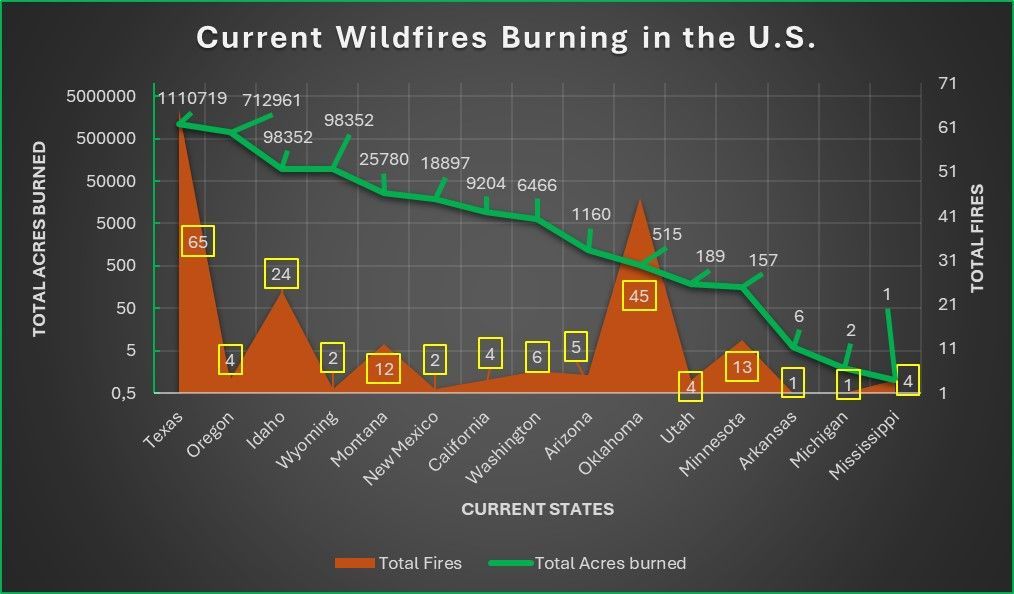
In total, 15 states are managing 233 active fires, affecting 2,157,464 acres [16].
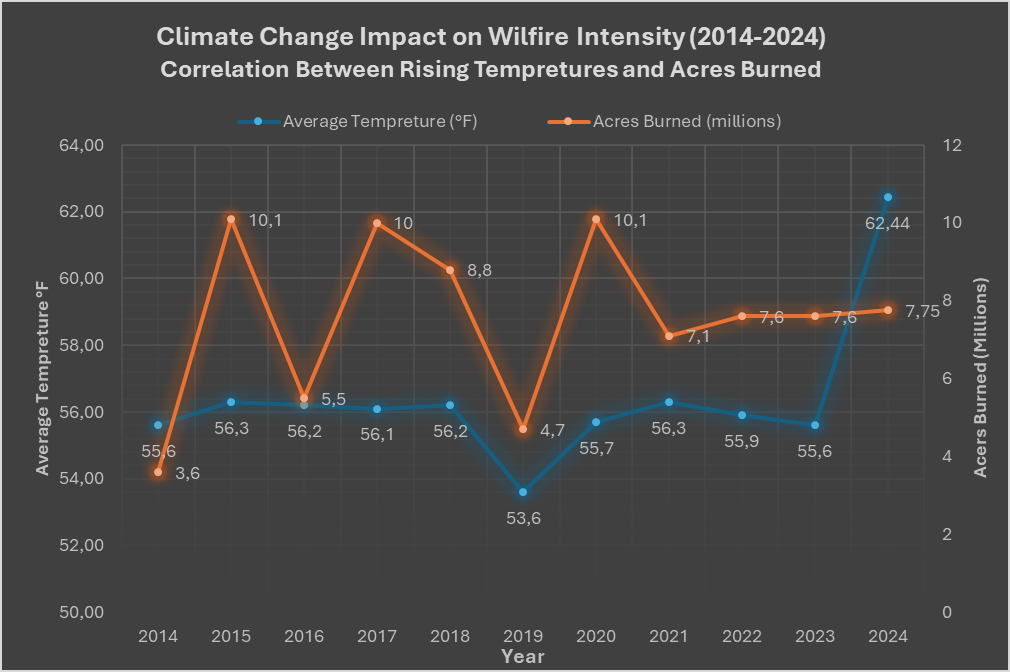
Climate Change and Wildfires
Influence of Climate Change on Wildfire Frequency and Severity
Climate change plays a significant role in increasing the frequency and severity of wildfires. Every year since 1997 has exceeded the 1910-2000 average temperature in North America [9]. Increased temperatures and prolonged drought conditions contribute to more combustible environments.
Between 1992 and 2022, 15 of the past 31 years saw the region from the Rocky Mountains westward categorized as abnormally dry or in drought [9].
How Climate Change is Increasing Fires and Carbon Emissions
Rising temperatures, prolonged droughts, and changing weather patterns create ideal conditions for wildfires to ignite and spread. As vegetation becomes drier and more susceptible to burning, fires become more frequent and intense. The connection between climate change and wildfires lies in the carbon emissions they produce.
The carbon emissions from wildfires can offset the greenhouse gas reductions achieved through other means. For example, California’s efforts to reduce emissions from transportation and industry can be counteracted by the significant carbon emissions resulting from wildfires. This creates a challenging situation where progress in reducing greenhouse gas emissions is negated by the carbon released during these devastating fires.
Chart 5: Climate Change Impact on WIldfire
Economic Impact of Climate-Related Disasters
Climate-related disasters, including wildfires, have led to substantial economic losses. In 2023, the U.S. experienced 28 separate billion-dollar weather and climate disasters, totalling $92.9 billion in costs [17].
In 2024 (as of November 1), there have been 24 confirmed weather/climate disaster events with losses exceeding $1 billion each to affect the United States. These events included 17 severe storm events, 4 tropical cyclone events, 1 wildfire event, and 2 winter storm events. Overall, these events resulted in the deaths of 418 people and had significant economic effects on the areas impacted.
Since 1980, the U.S. has sustained 376 billion-dollar disasters, with cumulative costs exceeding $2.660 trillion [17].
Policy Responses and Management Strategies
Federal and State Responses to Wildfires
The federal government is implementing proactive management strategies to address wildfire risks. The Forest Service plans to treat 20 million acres of federal lands and assist in treating an additional 30 million acres over the next decade [9]. The Infrastructure Investment and Jobs Act (2021) allocated $5.5 billion for fire management over five years [9].
In 2021, the Forest Service treated 3.7 million acres, and the Department of the Interior agencies treated 1.9 million acres [9].
Insurance Market Regulations
Regulators are taking steps to stabilize the insurance market amidst increasing wildfire risks. In 2023, California announced regulatory changes to enhance insurance availability and affordability [18]. The National Association of Insurance Commissioners (NAIC) is launching data calls to better understand property insurance markets in the context of climate risks [19].
Additionally, the Federal Insurance Office is advancing data collection efforts to assess climate-related financial risks [20].
Conclusion
Summary of Findings
This report highlights the escalating trends in wildfire occurrences, the substantial economic impacts, and the significant challenges facing the home insurance industry:
- Wildfires are increasing in severity, with average acres burned annually rising from 2.5 million acres in the 1980s to 7.9 million acres in 2024 [1, 1.1]
- Economic losses due to wildfires are mounting, with over $3.2 billion in damages between 2022 and 2023 [2]. and reaching $61 billion in 2024 [3]
- Home insurance premiums are rising sharply in high-risk areas, affecting affordability and coverage availability.
Implications for Homeowners and Insurers
The findings underscore the urgent need for:
- Homeowners to engage in proactive risk mitigation and understand the implications of living in high-risk areas.
- Insurers to adapt to changing risk landscapes and develop sustainable models for coverage in wildfire-prone regions.
- Policymakers to implement effective strategies that address climate change impacts and support both homeowners and the insurance industry.
Recommendations
- Enhance Risk Mitigation Efforts: Implement community-level fire prevention and preparedness programs to reduce wildfire risks.
- Promote Sustainable Insurance Solutions: Encourage public-private partnerships to stabilize insurance markets and expand coverage options.
- Address Climate Change: Strengthen policies aimed at mitigating climate change to reduce the underlying factors contributing to increased wildfire activity.
- Support Vulnerable Communities: Target resources and assistance to minority and low-income communities disproportionately affected by wildfires.
References
| Reference Number | Author/Organization | Title | URL |
|---|---|---|---|
| 1 | Brian O'Connell, The Motley Fool - The Ascent | Wildfire Insurance Statistics | https://www.fool.com/the-ascent/research/wildfire-insurance-statistics/ |
| 1.1 | National Fire News | Wildfire Statistics | https://www.nifc.gov/fire-information/nfn |
| 2 | National Centers for Environmental Information (NCEI) | Billion-Dollar Weather and Climate Disasters: Summary Stats | https://www.ncei.noaa.gov/access/billions/summary-stats/US/2022-2023 |
| 3 | National Centers for Environmental Information (NCEI) | Billion-Dollar Weather and Climate Disasters: Summary Stats | https://www.ncei.noaa.gov/access/billions/summary-stats/US/2022-2023 |
| 4 | Bankrate | Average Home Insurance Rates by State | https://www.bankrate.com/insurance/homeowners-insurance/homeowners-insurance-cost/ |
| 5 | MDPI | Racial and Ethnic Inequities in Wildfire Risks in the United States | https://www.mdpi.com/1999-4907/13/7/1130 |
| 6 | John Wake, Forbes | US Has 3rd Lowest Percentage Of Households That Own Their Homes Without Mortgages | https://www.forbes.com/sites/johnwake/2023/03/31/us-has-3rd-lowest-percentage-of-households-that-own-their-homes-without-mortgages |
| 7 | National Interagency Fire Center (NIFC) | Fire Information - Statistics | https://www.nifc.gov/fire-information/statistics |
| 8 | National Park Service (NPS) | Wildfire Causes and Evaluation | https://www.nps.gov/articles/wildfire-causes-and-evaluation.htm |
| 9 | Congressional Budget Office (CBO) | Federal Wildfire Management: Budgetary Costs and Trends in Wildfire Activity | https://www.cbo.gov/publication/58212 |
| 9.1 | U.S. Department of Agriculture | Federal Wildfire Management: Budgetary Costs and Trends in Wildfire Activity | https://www.usda.gov/media/press-releases/2023/03/09/presidents-2024-budget-advances-efforts-address-nations-wildfire |
| 10 | Insurance Information Institute (III) | Facts + Statistics: Wildfires | https://www.iii.org/fact-statistic/facts-statistics-wildfires |
| 10.5 | Safer America | Largest Wildfires in U.S. | https://safer-america.com/what-was-the-largest-wildfire-in-u-s-history/ |
| 11 | Verisk Analytics | FireLine State Risk Report | https://www.verisk.com/insurance/campaigns/location-fireline-state-risk-report/ |
| 12 | CAL FIRE | 2021 Incident Archive | https://www.fire.ca.gov/incidents/2021/ |
| 13 | CAL FIRE | 2024 Incident Archive | https://www.fire.ca.gov/incidents/2024 |
| 14 | Science Magazine | Disproportionate Burdens of Climate Change Evidence for a Systematic African American Health Disparity | https://www.science.org/doi/10.1126/science.abe4943 |
| 15 | National Interagency Fire Center (NIFC) | National Fire News | https://www.nifc.gov/fire-information/nfn |
| 16 | Fire, Weather & Avalanche Center | Current List of US Wildfires | https://www.fireweatheravalanche.org/fire/current-list-of-us-wildfires |
| 17 | NOAA Climate.gov | 2023 Is a Historic Year for US Billion-Dollar Weather and Climate Disasters | https://www.climate.gov/news-features/blogs/beyond-data/2023-historic-year-us-billion-dollar-weather-and-climate-disasters |
| 18 | California Department of Insurance | Commissioner Lara Announces Updated Regulations | https://www.insurance.ca.gov/0400-news/0100-press-releases/2023/release051-2023.cfm |
| 19 | National Association of Insurance Commissioners (NAIC) | NAIC Issues Data Call to Help Regulators Better Understand Property Insurance Markets | https://content.naic.org/article/naic-issue-data-call-help-regulators-better-understand-property-markets |
| 20 | U.S. Department of the Treasury | Federal Insurance Office Takes Next Step in Efforts to Assess Climate-Related Financial Risk | https://home.treasury.gov/news/press-releases/jy1867 |